Read logs with bash shell
This article is about how I read logs in the command line using tools: grep, awk, tr. I also remind some concepts in bash shell including file descriptors, variables, operators
Set up context
Weeks ago, a colleague introduced the maelstrom platform - which is a set of challenges, by solving those helps me to learn and understand how to implement a distributed system. My task is to write a web server, and maelstrom creates a network of multiple servers that simulate the distributed system.
For the Growth only counter challenge, it requires implementing a mechanism to keep track of the global counter among multiple nodes in a cluster.
Given a system includes 3 nodes n0, n1, n2; maelstrom sends a set of numbers randomly to each node in the system, and the final result is the sum of all messages sent. Let’s take a look at the example below:
Message set:
[1,2,3,4,5,0,4,2,5,1,3,4]
The request maelstrom broadcasts to each node are like following
*) maelstrom_c -> n0 [1,4,2,3]
*) maelstrom_c -> n1 [2,0,5,1]
*) maelstrom_c -> n3 [3,5,5,5]
Expected outcome after all messages are sent, each node should return the total count of the message set
At any time during the application is still running, the client sends a request to a node to get the global counter value of sum[1,2,3,4,5,0,4,2,5,1,3,4] which is 34
There are 2 requests, (1) add is to add messages to a node, (2) read is to get the global counter. Run the application on paper. It would be like this.
T01: maelstrom_c -> n0  add  1
T02: maelstrom_c -> n1  add  2
T03: maelstrom_c -> n2  add  3
T04: maelstrom_c -> n0  read 6  # the result is sum of [1,2,3]
T05: maelstrom_c -> n0  add  4
T06: maelstrom_c -> n1  read 10 # the result is sum of [1,2,3,4]
...
T99: maelstrom_c -> n0 read  34
T99: maelstrom_c -> n1 read  34
T99: maelstrom_c -> n2 read  34
I wrote an application and it failed on the first run. Next, I’ll show you how I debug by reading the application logs.
The maelstrom logs structures
For each test run, maelstrom produces a set of log files like the following. You can download the example here. These are log files of a failed case.
.
├── history.txt
├── node-logs
│  ├── n0.log
│  ├── n1.log
│  └── n2.log
├── results.edn
The meaning of each file:
results.edn: Analysis results. My test failed because (1) each node returns a different number of the global counter, (2) the expected global counter value is 1291{:perf {:latency-graph {:valid? true}, :rate-graph {:valid? true}, :valid? true}, :timeline {:valid? true}, :exceptions {:valid? true}, :stats {:valid? true, :count 1771, :ok-count 1771, :fail-count 0, :info-count 0, ... :final-reads (2881 4490 2780), (1) :acceptable ([1291 1291])}, (2) :valid? false}history.txt: The logical history of the system, as seen by clients. It stores all requests from the maelstrom client to nodes. Example:nemesis :info :start-partition :majorities-ring 1 :invoke :add 3 :nemesis :info :start-partition [:isolated {"n0" #{"n2"}, "n2" #{"n1"}, "n1" #{"n0"}}] 1 :ok :add 3 2 :invoke :read nil 2 :ok :read 0 0 :invoke :add 3 0 :ok :add 3 0 :invoke :read nil 0 :ok :read 3node-logs/n0.log,n1.log: The STDERR logs from each node. It also logs request sent/received by the node. Example2023/03/20 11:04:50 Received {c1 n0 {"type":"init","node_id":"n0","node_ids":["n0","n1","n2"],"msg_id":1}} 2023/03/20 11:04:50 Node n0 initialized 2023/03/20 11:04:50 Sent {"src":"n0","dest":"c1","body":{"in_reply_to":1,"type":"init_ok"}} 2023/03/20 11:04:50 Received {c8 n0 {"delta":3,"type":"add","msg_id":1}} 2023/03/20 11:04:50 Sent {"src":"n0","dest":"c8","body":{"in_reply_to":1,"type":"add_ok"}} 2023/03/20 11:04:50 Received {c8 n0 {"type":"read","msg_id":2}} 2023/03/20 11:04:50 Sent {"src":"n0","dest":"c8","body":{"in_reply_to":2,"type":"read_ok","value":3}} 2023/03/20 11:04:50 Received {c8 n0 {"delta":4,"type":"add","msg_id":3}} 2023/03/20 11:04:50 Sent {"src":"n0","dest":"c8","body":{"in_reply_to":3,"type":"add_ok"}} 2023/03/20 11:04:50 Received {c8 n0 {"type":"read","msg_id":4}}
For each log files above, each file has their own format.
Read the log
Reading log is the best way for debugging, the logs themselves contain valuable information about the execution. But sometimes this work is not easy especially when the log file is huge.
Check the counter logic
Goal: Get the total of all messages sent from maelstrom client
What I want to do is get all requests sent by the maelstrom client to the 3 nodes.
Firstly, let’s take an overview of the history.txt file with the command wc -l
The wc utility displays the number of lines, words, and bytes contained in each input file, or standard input (if no file is specified) to the standard output.
Count the number of lines of the specific file
wc -l history.txt
# Output: 3550 history.txt
Or count the number of lines from the stdin
cat history.txt | wc -l
# Output: 3350
The cat utility reads files sequentially, writing them to the standard output.
The pipe (|) operator takes output from one command and uses it as input for another.
It turns out the file has 3350 lines, opening it on a code editor heart my eyes. I lose my focus when there is a lot of information. Someone had said, the best way to deal with a big file is not to deal with big file.
There is a format for request sending from maelstrom client to a node
 0  :invoke :add    3
(1)   (2)    (3)   (4)
This line means - maelstrom sends the message “3” to node0. There are 4 columns in the logging template
- The node index
- The event (invoke/ok)
- The method (add/read)
- The parameter of the request
To filter the log for requests adding messages to nodes in the network I use grep command
The grep utility searches any given input files, selecting lines that match one or more patterns. By default, a pattern matches an input line if the regular expression (RE) in the pattern matches the input line without its trailing newline. An empty expression matches every line. Each input line that matches at least one of the patterns is written to the standard output.
grep ':add' history.txt
---
Output:
1       :invoke :add    3
1       :ok     :add    3
0       :invoke :add    3
0       :ok     :add    3
---
Output: 1176 lines (reduce 66% of redudant lines)
The output is like the following. It turns out that for each method, there are 2 events (:invoke, :ok); I only need one event. I continue to use grep command on the previous result set to capture the event :invoke only.
grep ':add' history.txt | grep ':invoke'
---
Output:
1       :invoke :add    3
0       :invoke :add    3
2       :invoke :add    4
0       :invoke :add    4
---
Output: 588 lines (reduce 84% of redudant lines)
Now I have filtered the messages sent from the maelstrom client, next I calculate the total of messages to validate the global counter. My target is the number at the end of each line, so I use awk command to remove the (1) node-index, (2) event and (3) method.
Awk scans each input file for lines that match any of a set of patterns specified literally in prog or in one or more files specified as -f progfile. With each pattern there can be an associated action that will be performed when a line of a file matches the pattern.
An input line is normally made up of fields separated by white space, or by the regular expression FS. The fields are denoted $1, $2, …, while $0 refers to the entire line. If FS is null, the input line is split into one field per character.
I see the log file has the table-liked format, there are 4 columns separated by <white-space> characters. The awk parses the format into a table, and it also provides functions to execute on each column. At this step, to get the message I only need to print the fourth column.
grep ':add' history.txt | grep ':invoke' | awk '{print $4}'
---
Output:
3
3
4
4
The data is cleaner now, the remaining task is to get the total of the message on each line.
The while read line is a common script to process or execute multi lines documents. You can think a multiple lines file is an array, each line in that file is an element of the array and elements are seperated by newline charactor \n.
Syntax for a while loop in bash shell:
while [condition]; do
    # execution
done
From the previous step, I have an array of numbers; I use the while read line to loop through the array and make execution with each element. For example I will append a phrase “Process with parameter” before each element of each line.
grep ':add' history.txt | grep ':invoke' | awk '{print $4}' | \
    while read line; do \
        echo "Process with parameter: "$line;\
    done
---
Output:
Process with parameter: 3
Process with parameter: 3
Process with parameter: 4
Process with parameter: 4
For each loop, the current line content is assigned to the line variable, so let’s do a quick review of the bash shell variable.
a=1             # Create new variable named `a` with value 1
b=2             # Create new variable named `b` with value 2
---
echo $a         # Print the value of variable `a`
# Output: 1
---
c=$(($a + $b))  # Perform math function sum [$a, $b] and assign the result to `c`
echo $c
# Output: 3
---
d=($a + $b)     # This is not performing a math function
echo $d
# Output: 1 + 2
Now let’s sum up all messages. I break the process into 3 steps
- Create
countervariable starting from 0 - Get the dataset
- Loop through the dataset and increase the counter with the number on each line
counter=0; \
grep ':add' history.txt | grep ':invoke' | awk '{print $4}' | \
    while read line; do \
        counter=$(($counter + $line));\
    done; \
echo "The global counter is "$counter
---
#Output: The global counter is 1291
Bingo! I double-checked the counter logic of maelstrom, and sadly confirm that there is something wrong with my code. But what’s wrong?
Read the node log
From the result.edn file, the global counter return by each node exceeds the actual counter, my hypothesis on the root cause is message duplication. In this step, I find the log evidence to prove my assumption.
:final-reads (2881 4490 2780),
---
Counter result for each node:
n0: 2881 | n1: 4490 | n3: 2780
Remind you about the context. The challenge is keeping track of the global counter of a system of 3 nodes because messages are sent randomly to a node so my approach is to replicate the messages among nodes in the network. For each node, whenever it receives a message from the maelstrom client, it packs messages to a batch in a buffer and periodically replicates to its peer and clears the buffer for the next cycle. The nodes store all messages they received in their local storage, to return the global counter they sum all messages in their local storage and return.
T01: maelstrom_c -> n0  add  1           # buffer_n0:[1]
T02: maelstrom_c -> n0  add  2           # buffer_n0:[1,2]
T03: maelstrom_c -> n1  add  3           # buffer_n1:[3]
T04: n0          -> n1  replicate [1,2]  # buffer_n0:[]
T05: n1          -> n0  replicate [3]    # buffer_n1:[]
T06: maelstrom_c _> n1  read 6
T06: maelstrom_c _> n0  read 6
The local storage of n0 & n1 through time
| Time | n0 | n1 |
| T01 | [1] | [] |
| T02 | [1,2] | [] |
| T03 | [1,2] | [3] |
| T04 | [1,2] | [3,1,2] |
| T05 | [1,2,3] | [3,1,2] |
I inspect the log file of node0 at path node-logs/n0.log. Let’s take an overview
Next I will look into log file of node0 at path node-logs/n0.log. I’ll filter all request this node received to check if there is a duplication.
For each request the node received, it would have a format like the following:
2023/03/20 11:04:50 Received {c8  n0  {"delta":3,"type":"add","msg_id":1}}
    (1)       (2)     (3)    (4)  (5)                 (6)
There are 4 fields:
- Date
- Time
- Event
- Sender address
- Receiver address
- The request payload is the information that is exchanged from node to node or from client to node. Example on the request payload for replicate request
{"msg_id":95,"type":"replicate","values":[1,2]}
From the node0, it has 3 clients which are the maelstromg client, node1, and node2. Firstly I’ll check if node0 recieved duplicated request from maelstrom client.
Check all messages sent to node0 on file history.txt. I use regex ^0 to capture lines that have the first character matches 0.
grep '^0' history.txt| grep ':invoke' | grep ':add' | wc -l
---
# Output: 295
Check all messages node0 received from maelstrom client on file node-logs/n0.log. I capture the line has the word Received, sent from address starts with c, and the request payload contains "type":"add"
grep 'Received' node-logs/n0.log | grep '{c' | grep '"type":"add"'| wc -l
---
# Output: 295
The two scripts above return the same result which means no duplication in requests sent from maelstrom client to node0.
The two types of requests that take effect on the local storage of node0 are (1) add from the maelstrom client and (2) replicate from node1 & node2, I have just eliminated the possibility of the first one.
To find the evidence of the duplicated replicate requests, I observe the exchange of node0 and node1.
grep 'Received' node-logs/n0.log | grep '{n1' | grep '"type":"replicate"'
---
# Output:
2023/03/20 11:04:51 Received {n1 n0 {"msg_id":2,"type":"replicate","values":[3,2,3,1,4,2,3,1,4,3]}}
2023/03/20 11:04:52 Received {n1 n0 {"msg_id":4,"type":"replicate","values":[2,1,1,0,1,0,1,0]}}
2023/03/20 11:04:52 Received {n1 n0 {"msg_id":5,"type":"replicate","values":[3,2,3,1,4,2,3,1,4,3]}}
2023/03/20 11:04:53 Received {n1 n0 {"msg_id":8,"type":"replicate","values":[0,4,3,2,2]}}
2023/03/20 11:04:53 Received {n1 n0 {"msg_id":9,"type":"replicate","values":[2,1,1,0,1,0,1,0]}}
2023/03/20 11:04:53 Received {n1 n0 {"msg_id":11,"type":"replicate","values":[3,2,3,1,4,2,3,1,4,3]}}
2023/03/20 11:04:54 Received {n1 n0 {"msg_id":14,"type":"replicate","values":[3,2,1,4,4,4,2]}}
2023/03/20 11:04:54 Received {n1 n0 {"msg_id":16,"type":"replicate","values":[0,4,3,2,2]}}
2023/03/20 11:04:54 Received {n1 n0 {"msg_id":18,"type":"replicate","values":[2,1,1,0,1,0,1,0]}}
2023/03/20 11:04:54 Received {n1 n0 {"msg_id":19,"type":"replicate","values":[3,2,3,1,4,2,3,1,4,3]}}
When the dataset is clean, some hint shows up. I picked up a random request, and query with its value set.
grep 'Received' node-logs/n0.log | grep '{n1' | grep '"type":"replicate"' | grep '3,2,3,1,4,2,3,1,4,3'
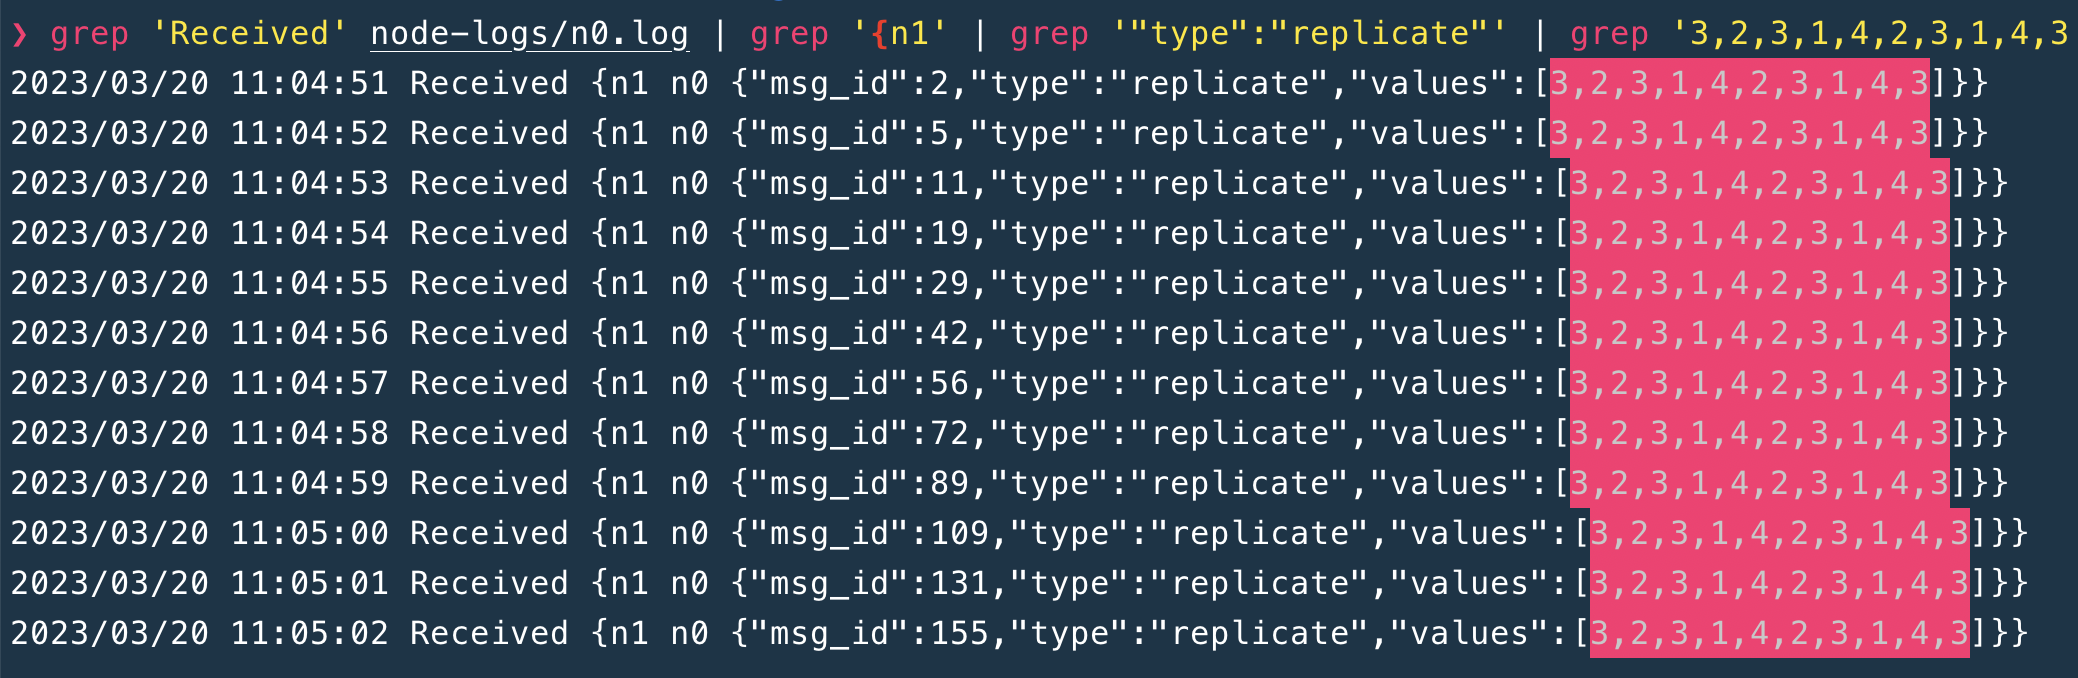
Tada!!! I found it 😇
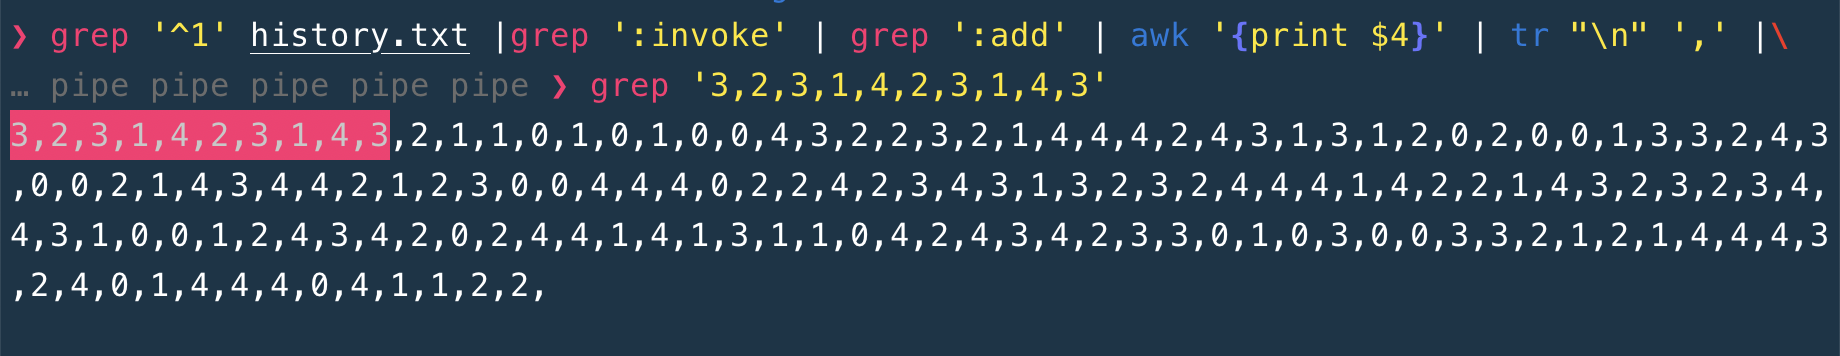
To be sure, I check the batch message with order 3,2,3,1,4,2,3,1,4,3 is unique in the node1 local storage
Filter messages sent to node1 from maelstrom client
grep '^1' history.txt |grep ':invoke' | grep ':add' | awk '{print $4}'
---
# Output
3
2
3
1
4
Then, use tr command to replace new-line \n characters with , so I got a list of message in one line.
grep '^1' history.txt |grep ':invoke' | grep ':add' | awk '{print $4}' | tr "\n" ','
---
# Output: 3,2,3,1,4,2,3,1,4,3,2,1,1,0,1...
The tr utility copies the standard input to the standard output with substitution or deletion of selected characters.
Finally, I grep the replicate batch message ordered in the order of received messages set of node1
grep '^1' history.txt |grep ':invoke' | grep ':add' | awk '{print $4}' | tr "\n" ',' | \
    grep '3,2,3,1,4,2,3,1,4,3'
Conclusion
When you reach these lines, I believe you have known how to use the command grep to remove redundant information, handle table-like format with awk and use the script while read line to execute on multi lines.
Thank you for reading!